Visualize economics & business data
Paste a table or upload a CSV, ask in plain English, and Vizionary returns the right chart.
Why Choose Vizionary
Transform complex economics and business data into clear, decision - ready insights with our intelligent visualization platform.
What You Can Visualize
From economic indicators to growth analysis, Vizionary handles all types of business and financial data with intelligent chart selection.
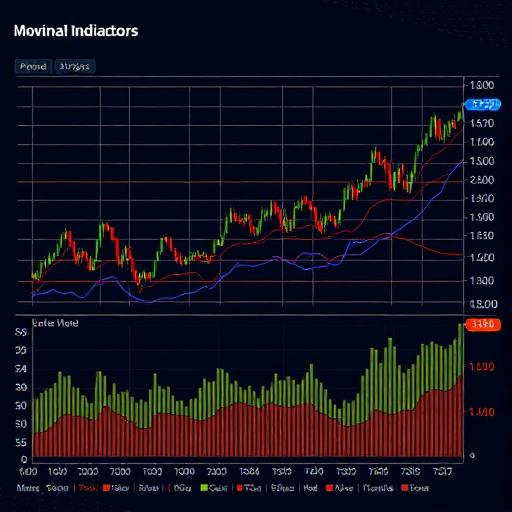
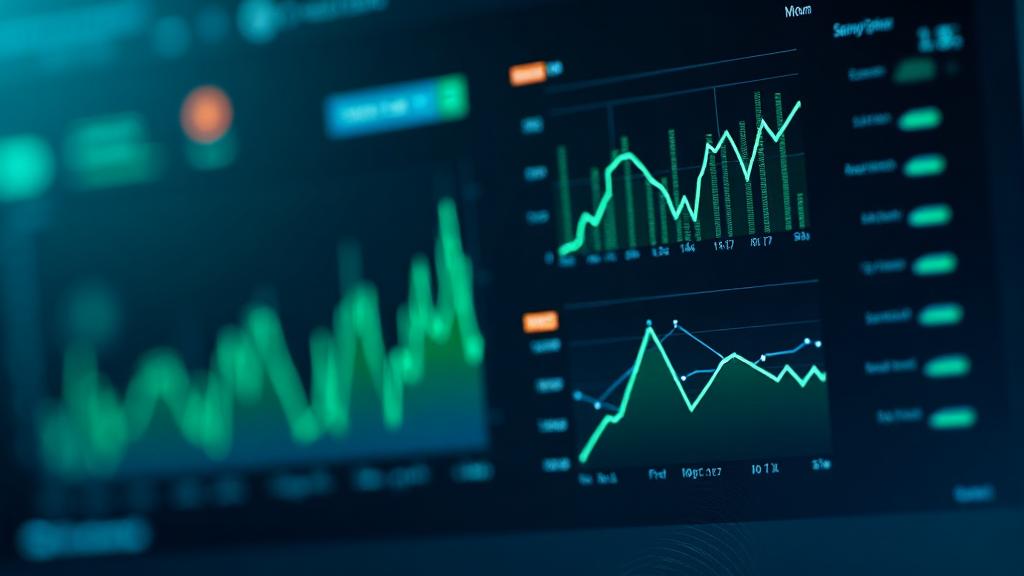
Economic indicators over time
Track indexes/rates with moving averages and context bands.
Chart: Multi-line / Area
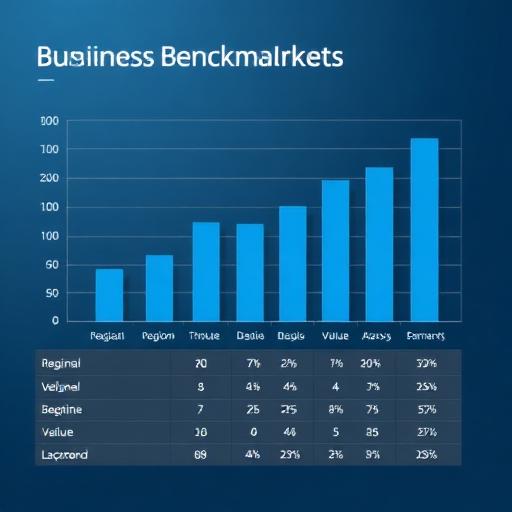
Benchmarks & comparisons
Compare groups with variance to baseline and % difference.
Chart: Grouped Bar / Multi-line
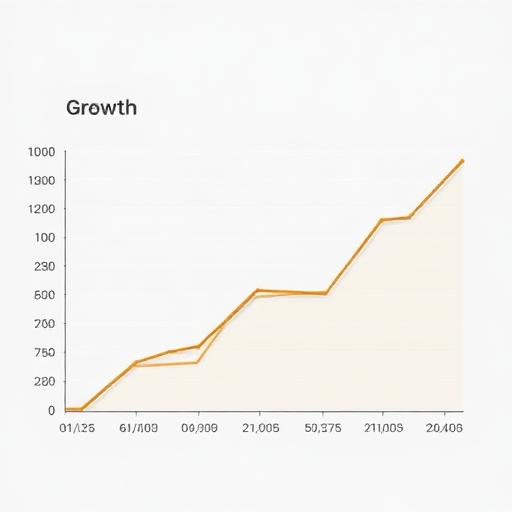
Growth & compounding
Show historical growth, CAGR, and simple projections.
Chart: Line with Projection
Funnels & user flows
Visualize step-by-step conversion and drop-offs.
Chart: Funnel / Sankey
